Notebook Images
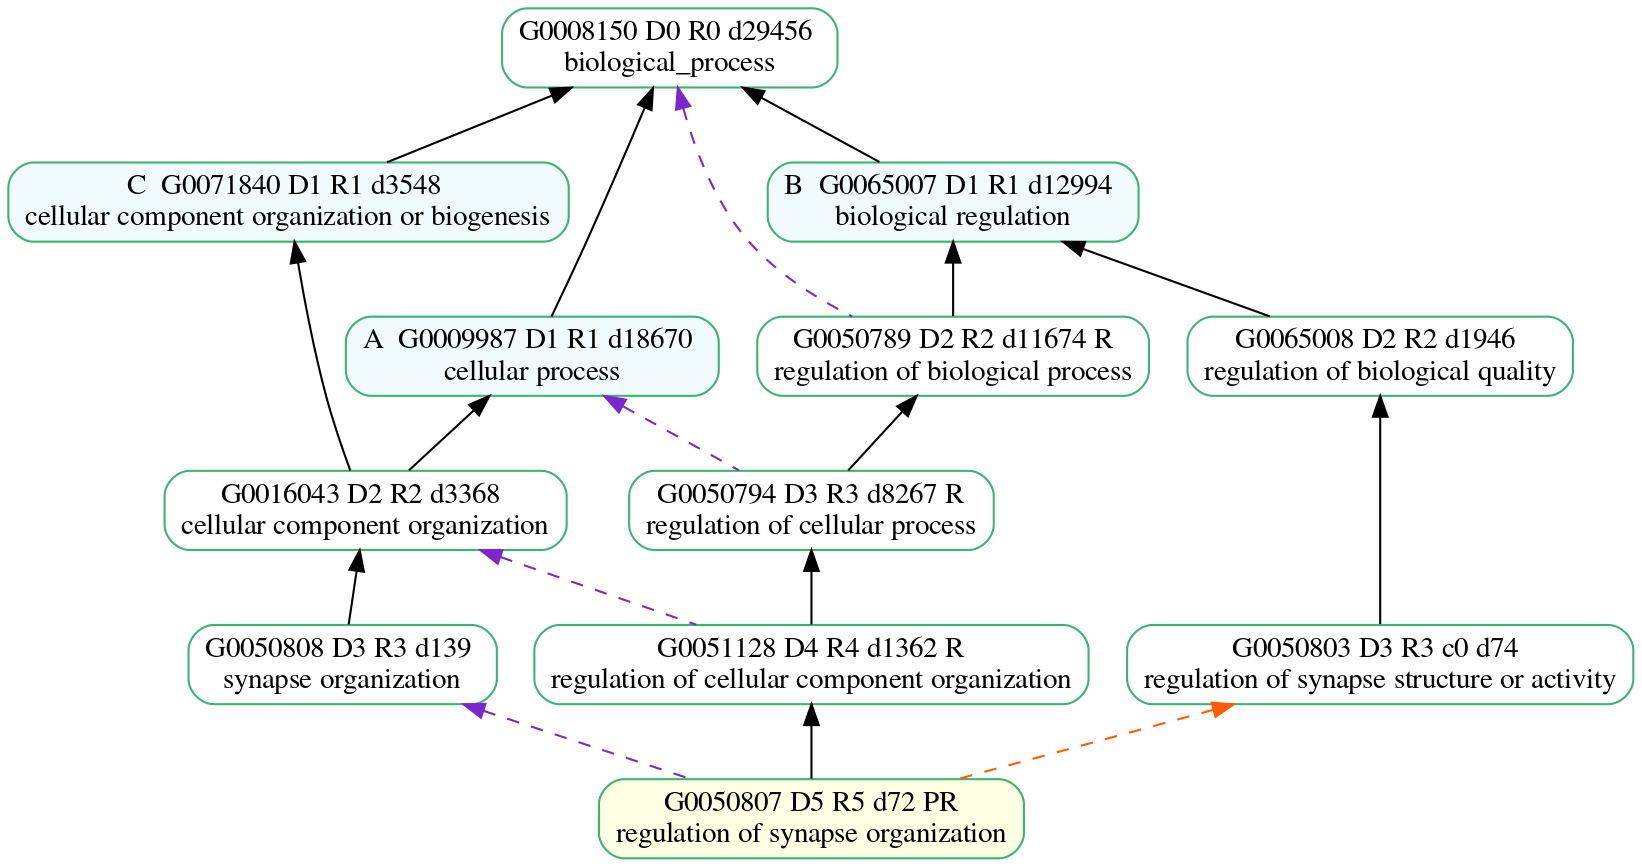
GO parents
Nature paper GOEA results
All Cellular Components
Big messy spaghetti plot. Molecular function and Biological process plots are bigger and messier.
Colors indicate GOEA pvalues:
pval < 0.005 (light red)
pval < 0.01 (light orange)
pval < 0.05 (yellow)

A subplot of GOEA results
As well as printing the big plot shown above. You can also create a sub-plot.
Study gene counts are annotated to plots. e.g, 32 genes
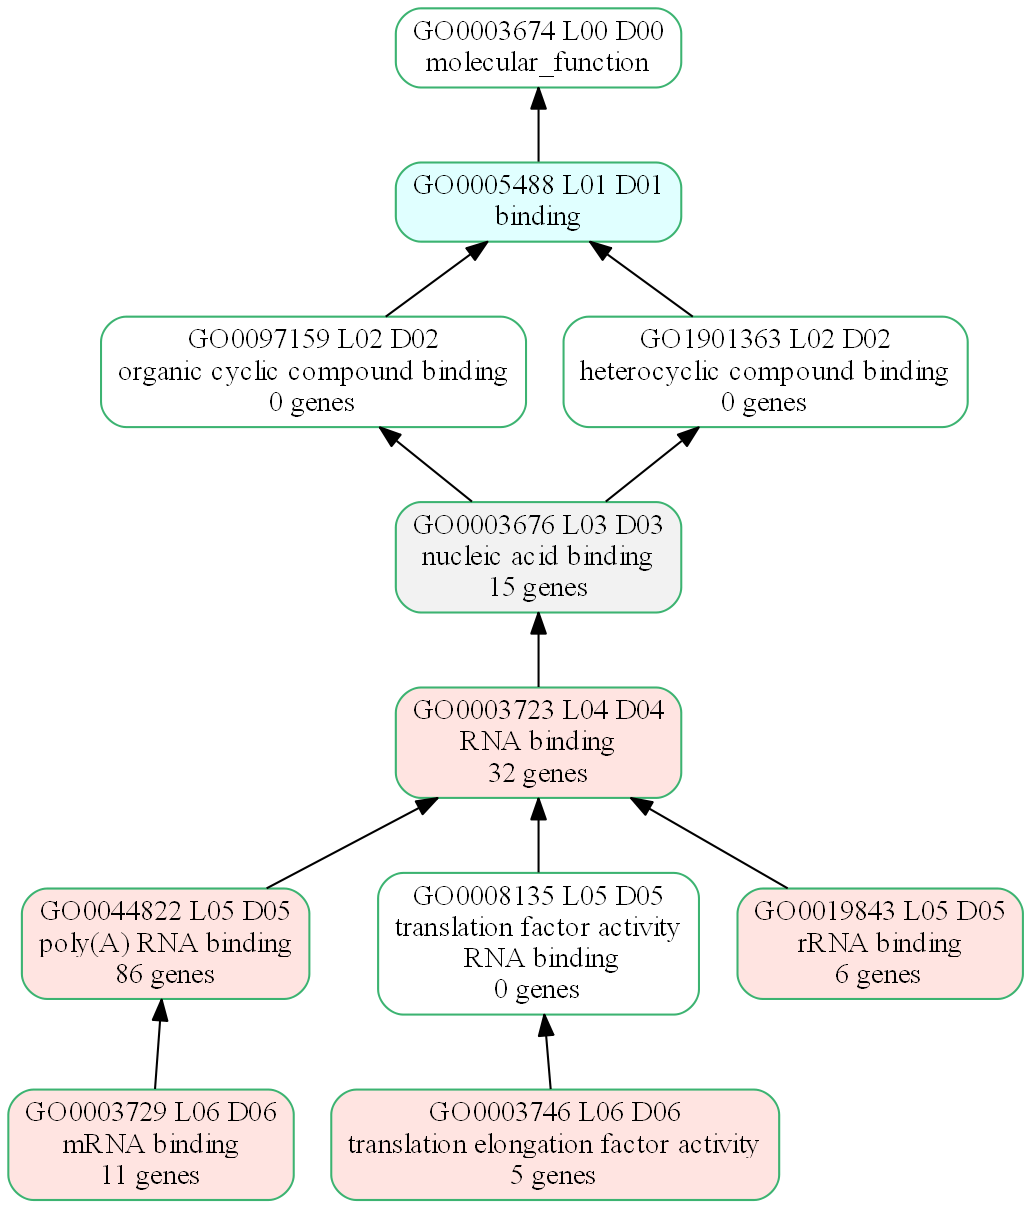
A subplot of GOEA results
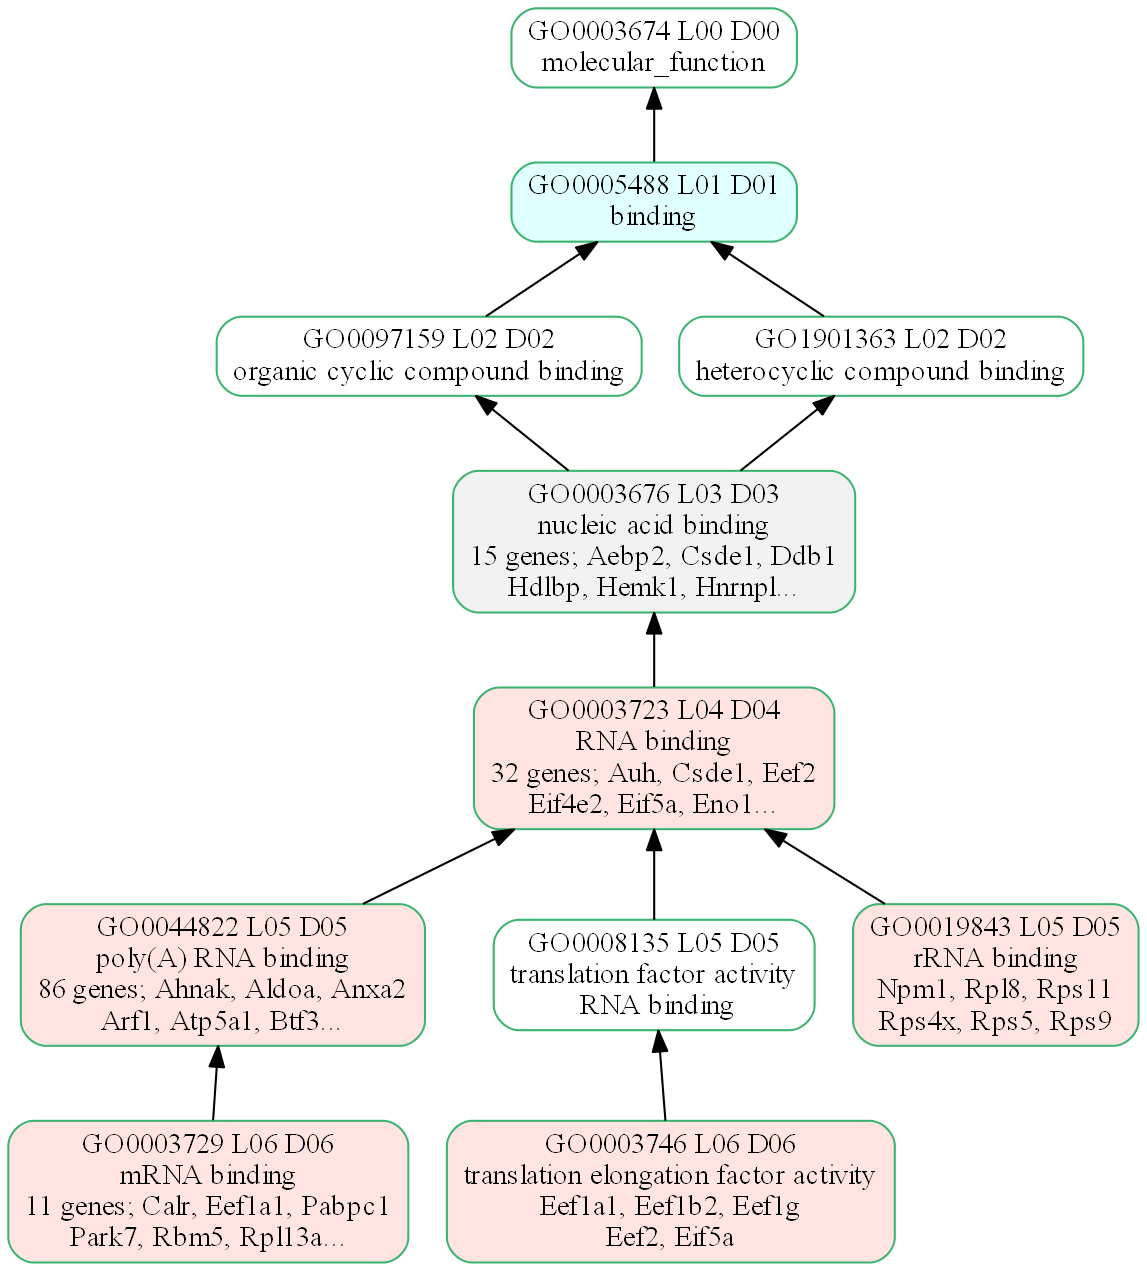
Instead of gene counts, shows a sampling of study gene Symbols on GO term boxes.
e.g., 32 genes; Ayh, Csdel, Eef2
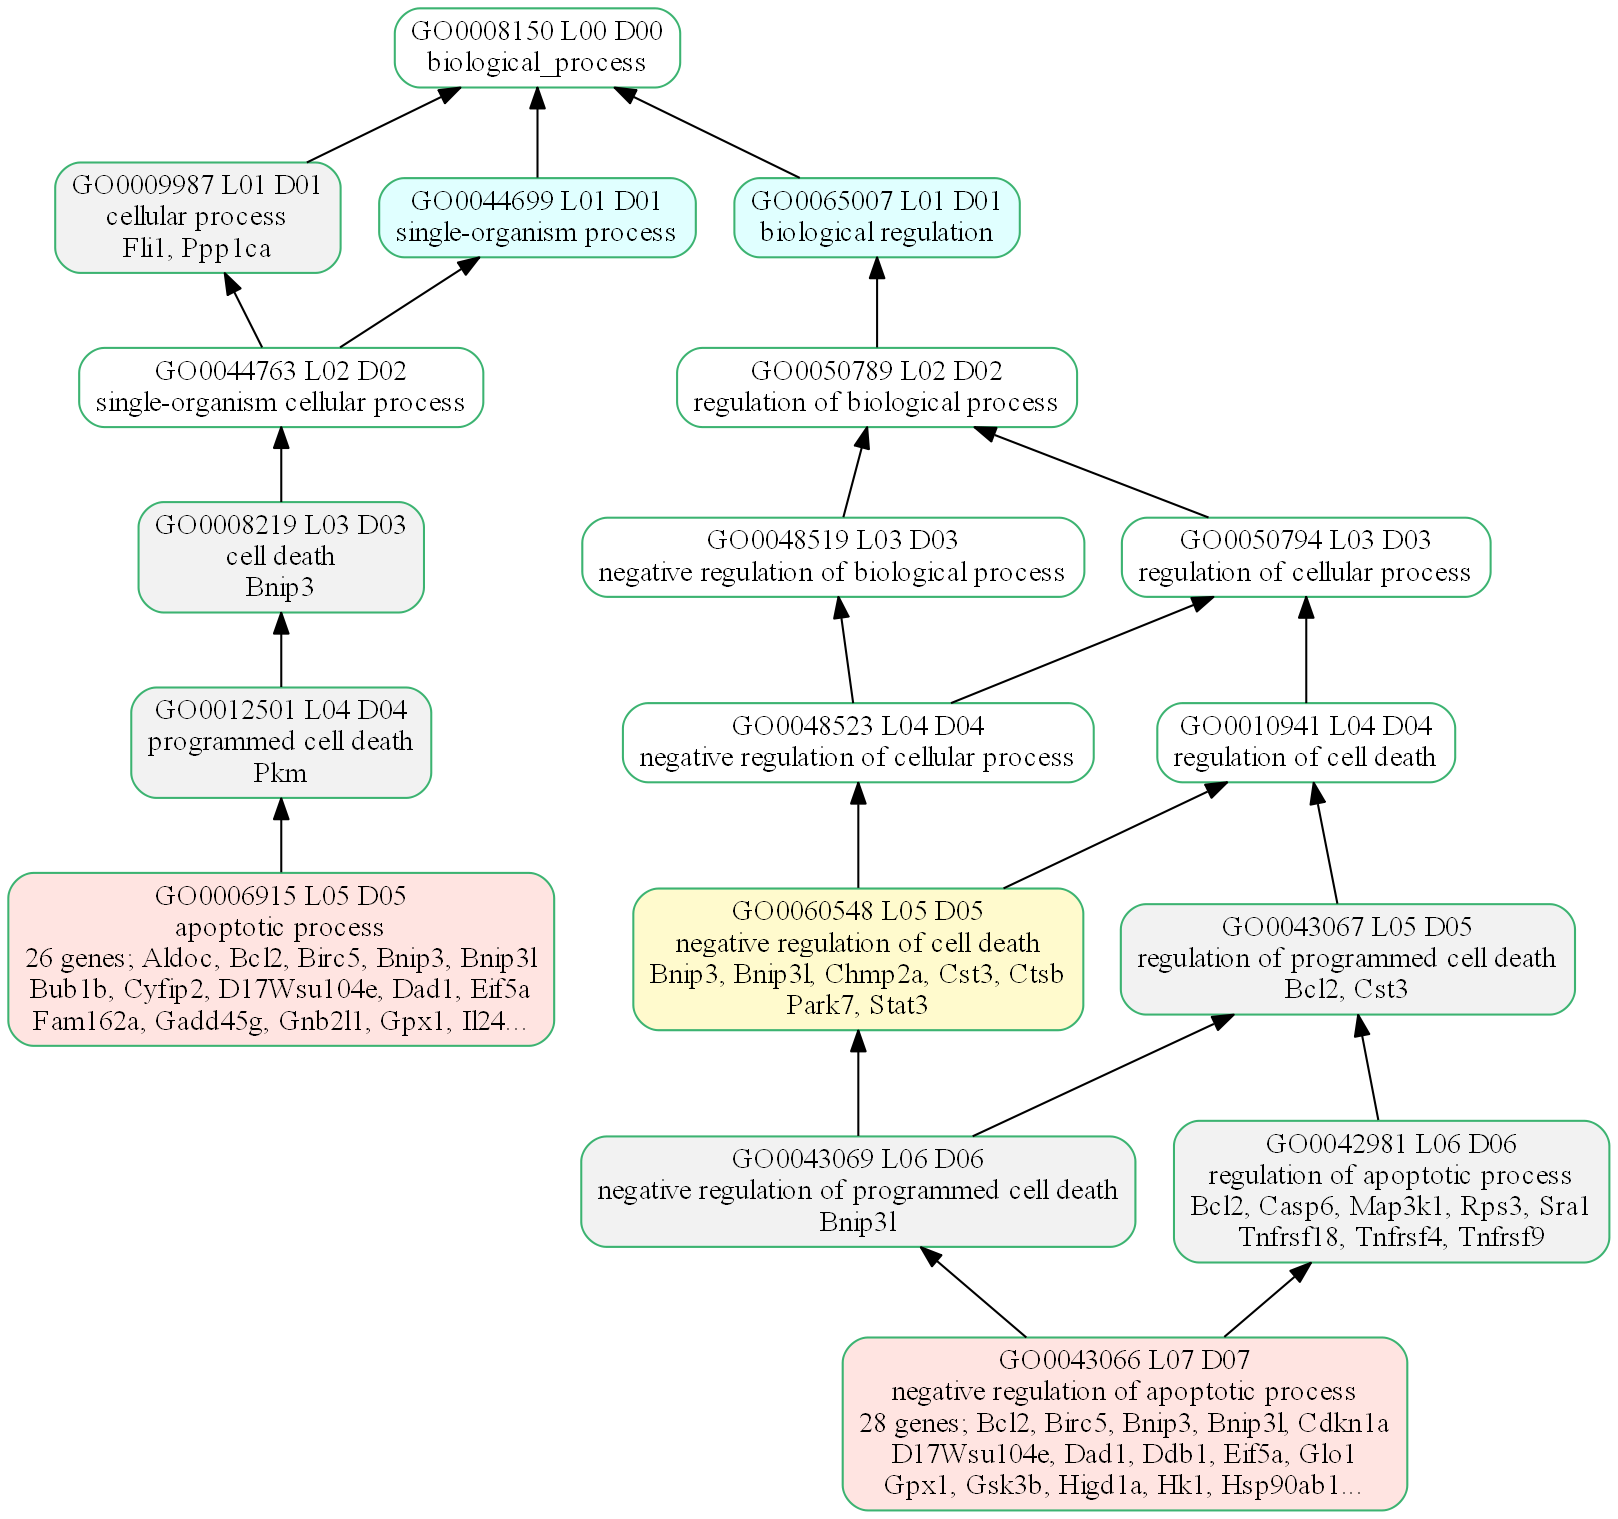
A subplot showing signficant GO terms related to apoptosis
Copyright (C) 2010-present, H Tang et al. All rights reserved.