Run a Gene Ontology Enrichment Analysis (GOEA)
We use data from a 2014 Nature paper:
Computational analysis of cell-to-cell heterogeneity
in single-cell RNA-sequencing data reveals hidden
subpopulations of cells
Note: you must have the Python packages, xlrd, pandas and openpyxl, installed to run this example.
Note: To create plots, you must have:
Python packages: pyparsing, pydot
Graphviz loaded and your PATH environmental variable pointing to the Graphviz bin directory.
1. Download Ontologies and Associations
1a. Download Ontologies, if necessary
# Get http://geneontology.org/ontology/go-basic.obo
from goatools.base import download_go_basic_obo
obo_fname = download_go_basic_obo()
EXISTS: go-basic.obo
1b. Download Associations, if necessary
The NCBI gene2go file contains numerous species. We will select mouse shortly.
# Get ftp://ftp.ncbi.nlm.nih.gov/gene/DATA/gene2go.gz
from goatools.base import download_ncbi_associations
fin_gene2go = download_ncbi_associations()
EXISTS: gene2go
2. Load Ontologies, Associations and Background gene set
2a. Load Ontologies
from goatools.obo_parser import GODag

obodag = GODag("go-basic.obo")
go-basic.obo: fmt(1.2) rel(2020-01-01) 47,337 GO Terms
2b. Load Associations
from __future__ import print_function
from goatools.anno.genetogo_reader import Gene2GoReader

# Read NCBI's gene2go. Store annotations in a list of namedtuples
objanno = Gene2GoReader(fin_gene2go, taxids=[10090])

# Get namespace2association where:
#    namespace is:
#        BP: biological_process
#        MF: molecular_function
#        CC: cellular_component
#    assocation is a dict:
#        key: NCBI GeneID
#        value: A set of GO IDs associated with that gene
ns2assoc = objanno.get_ns2assc()

for nspc, id2gos in ns2assoc.items():
    print("{NS} {N:,} annotated mouse genes".format(NS=nspc, N=len(id2gos)))
HMS:0:00:07.052179 367,335 annotations, 24,267 genes, 18,190 GOs, 1 taxids READ: gene2go
BP 17,859 annotated mouse genes
MF 16,721 annotated mouse genes
CC 18,824 annotated mouse genes
2c. Load Background gene set
In this example, the background is all mouse protein-codinge genes.
from goatools.test_data.genes_NCBI_10090_ProteinCoding import GENEID2NT as GeneID2nt_mus
print(len(GeneID2nt_mus))
26033
3. Initialize a GOEA object
The GOEA object holds the Ontologies, Associations, and background.
Numerous studies can then be run withough needing to re-load the above items.
In this case, we only run one GOEA.
from goatools.goea.go_enrichment_ns import GOEnrichmentStudyNS

goeaobj = GOEnrichmentStudyNS(
        GeneID2nt_mus.keys(), # List of mouse protein-coding genes
        ns2assoc, # geneid/GO associations
        obodag, # Ontologies
        propagate_counts = False,
        alpha = 0.05, # default significance cut-off
        methods = ['fdr_bh']) # defult multipletest correction method
Load BP Gene Ontology Analysis ...
fisher module not installed.  Falling back on scipy.stats.fisher_exact
 65% 16,811 of 26,033 population items found in association

Load CC Gene Ontology Analysis ...
fisher module not installed.  Falling back on scipy.stats.fisher_exact
 70% 18,198 of 26,033 population items found in association

Load MF Gene Ontology Analysis ...
fisher module not installed.  Falling back on scipy.stats.fisher_exact
 63% 16,331 of 26,033 population items found in association
4. Read study genes
~400 genes from the Nature paper supplemental table 4
import os
import goatools
# Get xlsx filename where data is stored
ROOT = os.path.dirname(goatools.__file__) # goatool root directory
din_xlsx = os.path.join(ROOT, "test_data", "nbt_3102", "nbt.3102-S4_GeneIDs.xlsx")
# Read data
if os.path.isfile(din_xlsx):
    import pandas as pd
    df = pd.read_excel(
        din_xlsx,
        header=None,
        names=["symbol", "geneid", "pval"],
        dtype={"symbol": str, "geneid": int, "pval": float},
        index_col=1,
    )  # requires openpyxl
    geneid2symbol = df["symbol"].to_dict()
    print('{N} genes READ: {XLSX}'.format(N=len(geneid2symbol), XLSX=din_xlsx))
else:
    raise RuntimeError('FILE NOT FOUND: {XLSX}'.format(XLSX=din_xlsx))
400 genes READ: /mnt/c/Users/note2/Data/git/goatools/goatools/test_data/nbt_3102/nbt.3102-S4_GeneIDs.xlsx
5. Run Gene Ontology Enrichment Analysis (GOEA)
You may choose to keep all results or just the significant results. In this example, we choose to keep only the significant results.
# 'p_' means "pvalue". 'fdr_bh' is the multipletest method we are currently using.
geneids_study = geneid2symbol.keys()
goea_results_all = goeaobj.run_study(geneids_study)
goea_results_sig = [r for r in goea_results_all if r.p_fdr_bh < 0.05]
Run BP Gene Ontology Analysis: current study set of 400 IDs ... 94%    357 of    381 study items found in association
 95%    381 of    400 study items found in population(26033)
Calculating 12,254 uncorrected p-values using fisher_scipy_stats
  12,254 GO terms are associated with 16,811 of 26,033 population items
   2,085 GO terms are associated with    357 of    400 study items
  METHOD fdr_bh:
      55 GO terms found significant (< 0.05=alpha) ( 53 enriched +   2 purified): statsmodels fdr_bh
     209 study items associated with significant GO IDs (enriched)
       4 study items associated with significant GO IDs (purified)

Run CC Gene Ontology Analysis: current study set of 400 IDs ... 99%    376 of    381 study items found in association
 95%    381 of    400 study items found in population(26033)
Calculating 1,724 uncorrected p-values using fisher_scipy_stats
   1,724 GO terms are associated with 18,198 of 26,033 population items
     449 GO terms are associated with    376 of    400 study items
  METHOD fdr_bh:
      83 GO terms found significant (< 0.05=alpha) ( 83 enriched +   0 purified): statsmodels fdr_bh
     373 study items associated with significant GO IDs (enriched)
       0 study items associated with significant GO IDs (purified)

Run MF Gene Ontology Analysis: current study set of 400 IDs ... 89%    339 of    381 study items found in association
 95%    381 of    400 study items found in population(26033)
Calculating 4,145 uncorrected p-values using fisher_scipy_stats
   4,145 GO terms are associated with 16,331 of 26,033 population items
     580 GO terms are associated with    339 of    400 study items
  METHOD fdr_bh:
      54 GO terms found significant (< 0.05=alpha) ( 52 enriched +   2 purified): statsmodels fdr_bh
     276 study items associated with significant GO IDs (enriched)
       0 study items associated with significant GO IDs (purified)
5a. Quietly Run Gene Ontology Enrichment Analysis (GOEA)
GOEAs can be run quietly using prt=None:
goea_results = goeaobj.run_study(geneids_study, prt=None)
No output is printed if prt=None:
goea_quiet_all = goeaobj.run_study(geneids_study, prt=None)
goea_quiet_sig = [r for r in goea_results_all if r.p_fdr_bh < 0.05]
Print customized results summaries
Example 1: Significant v All GOEA results
print('{N} of {M:,} results were significant'.format(
    N=len(goea_quiet_sig),
    M=len(goea_quiet_all)))
192 of 18,123 results were significant
Example 2: Enriched v Purified GOEA results
print('Significant results: {E} enriched, {P} purified'.format(
    E=sum(1 for r in goea_quiet_sig if r.enrichment=='e'),
    P=sum(1 for r in goea_quiet_sig if r.enrichment=='p')))
Significant results: 188 enriched, 4 purified
Example 3: Significant GOEA results by namespace
import collections as cx
ctr = cx.Counter([r.NS for r in goea_quiet_sig])
print('Significant results[{TOTAL}] = {BP} BP + {MF} MF + {CC} CC'.format(
    TOTAL=len(goea_quiet_sig),
    BP=ctr['BP'],  # biological_process
    MF=ctr['MF'],  # molecular_function
    CC=ctr['CC'])) # cellular_component
Significant results[192] = 55 BP + 54 MF + 83 CC
6. Write results to an Excel file and to a text file
goeaobj.wr_xlsx("nbt3102.xlsx", goea_results_sig)
goeaobj.wr_txt("nbt3102.txt", goea_results_sig)
    192 items WROTE: nbt3102.xlsx
    192 GOEA results for   375 study items. WROTE: nbt3102.txt
7. Plot all significant GO terms
Plotting all significant GO terms produces a messy spaghetti plot. Such a plot can be useful sometimes because you can open it and zoom and scroll around. But sometimes it is just too messy to be of use.
The “{NS}” in “nbt3102_{NS}.png” indicates that you will see three plots, one for “biological_process”(BP), “molecular_function”(MF), and “cellular_component”(CC)
from goatools.godag_plot import plot_gos, plot_results, plot_goid2goobj

plot_results("nbt3102_{NS}.png", goea_results_sig)
   55 usr 444 GOs  WROTE: nbt3102_BP.png
   83 usr 149 GOs  WROTE: nbt3102_CC.png
   54 usr 156 GOs  WROTE: nbt3102_MF.png
7a. These plots are likely to messy
The Cellular Component plot is the smallest plot…

7b. So make a smaller sub-plot
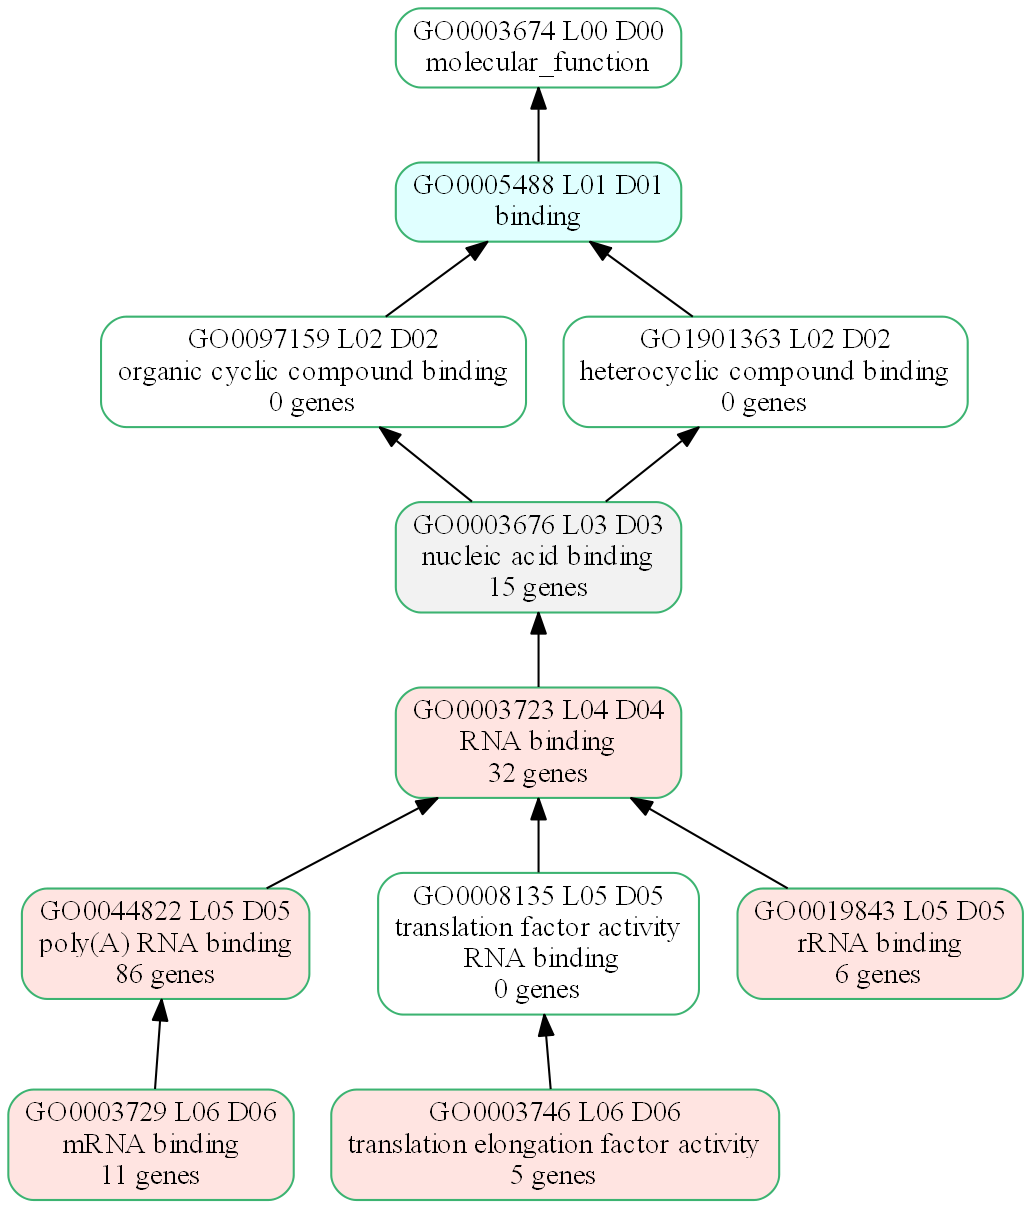
This plot contains GOEA results:
GO terms colored by P-value:
pval < 0.005 (light red)
pval < 0.01 (light orange)
pval < 0.05 (yellow)
pval > 0.05 (grey) Study terms that are not statistically significant
GO terms with study gene counts printed. e.g., “32 genes”
# Plot subset starting from these significant GO terms
goid_subset = [
    'GO:0003723', # MF D04 RNA binding (32 genes)
    'GO:0044822', # MF D05 poly(A) RNA binding (86 genes)
    'GO:0003729', # MF D06 mRNA binding (11 genes)
    'GO:0019843', # MF D05 rRNA binding (6 genes)
    'GO:0003746', # MF D06 translation elongation factor activity (5 genes)
]
plot_gos("nbt3102_MF_RNA_genecnt.png",
    goid_subset, # Source GO ids
    obodag,
    goea_results=goea_results_all) # Use pvals for coloring
5 usr 13 GOs WROTE: nbt3102_MF_RNA_genecnt.png
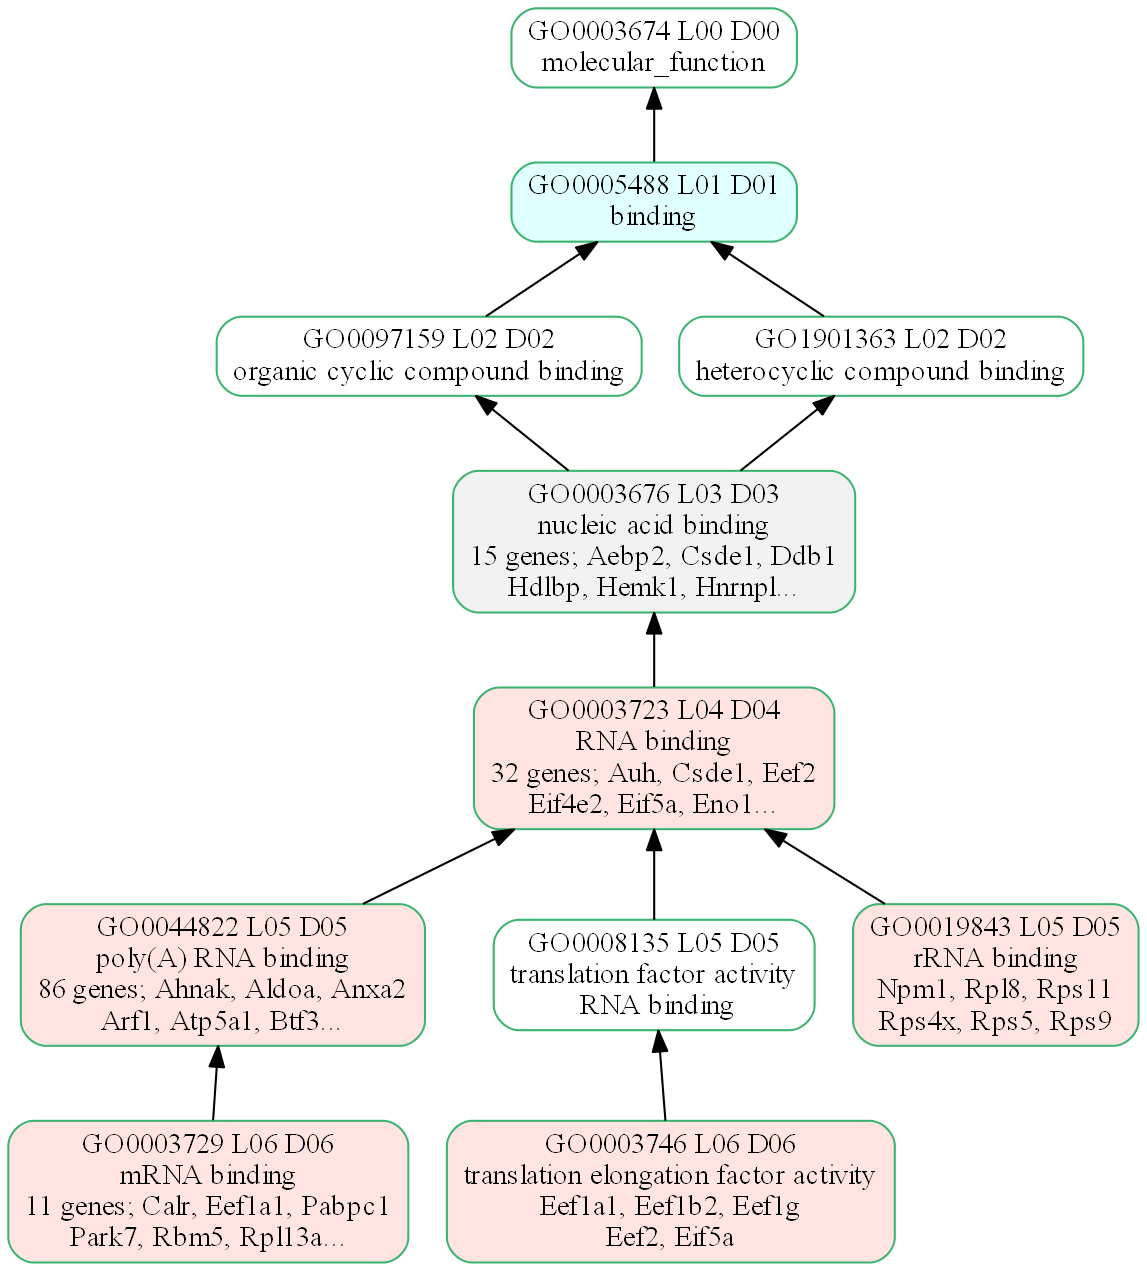
7c. Add study gene Symbols to plot
e.g., 11 genes: Calr, Eef1a1, Pabpc1
plot_gos("nbt3102_MF_RNA_Symbols.png",
    goid_subset, # Source GO ids
    obodag,
    goea_results=goea_results_all, # use pvals for coloring
    # We can further configure the plot...
    id2symbol=geneid2symbol, # Print study gene Symbols, not Entrez GeneIDs
    study_items=6, # Only only 6 gene Symbols max on GO terms
    items_p_line=3, # Print 3 genes per line
    )
5 usr 13 GOs WROTE: nbt3102_MF_RNA_Symbols.png
Copyright (C) 2016-present, DV Klopfenstein, H Tang. All rights reserved.