How to get GO IDs up both the ‘is a’ and ‘part of’ relationships
Download Ontologies, if necessary
Choose a set of GO IDs to print
GO colors for plotting
Traverse up or down the GO DAG with no, all, or some optional relationships(a): * 4a) No optional relationships, like part_of and regulates * 4b) All relationships * 4c) Relationship: part_of * 4d) Relationship: regulates * 4e) Relationship: positively_regulates * 4f) Relationship: negatively_regulates
a) The is_a relationships will always be traversed to find the children or parents of a GO term
Plots with and without relationships
Arrows denote the relationships, is_a (solid black arrows) and part_of (dashed orange arrows), in the plots below:
With no optional relationships |
With the optional part_of relationship |
|---|---|
|
|
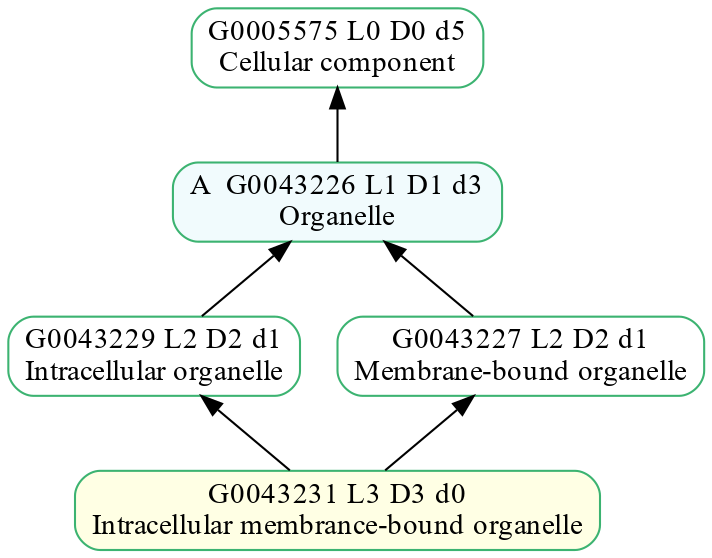
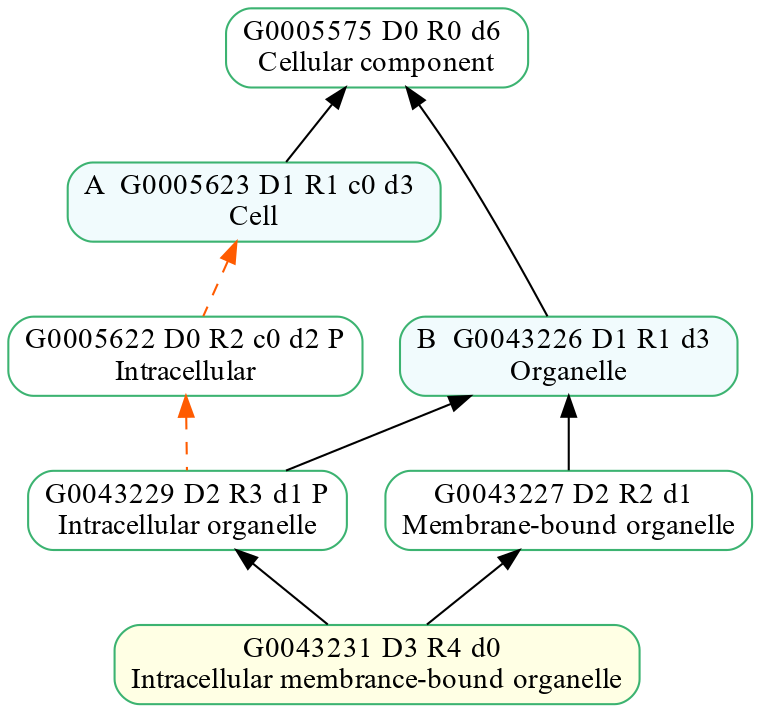
Notice that the text in the GO term box is different if you are plotting using optional relationships. The bottom GO term text is:
Left plot: GO:0043231 L3 D3 d0
Right plot: GO:0043231 D3 R4 d0
L (Level) is the minimum distance from root term, cellular_component, to the bottom term
D (Depth), is the maximum distance from root term, cellular_component, to the bottom term using only is_a relationships
R (Depth using optional relationships), is the maximum distance from root term, cellular_component, to the bottom term using both is_a and optional relationships
In this example D (Depth) from the root to the bottom term is 3 (light blue lines).
And R (Depth using optional relationships) from the root to the bottom is 4 (dark purple lines) because it traverses the part_of relationships

1. Download Ontologies, if necessary
Load all relationships into a GODag object.
Specific relationships, like part_of or regulates, will be chosen using GoSubDag.
from goatools.base import get_godag
godag = get_godag("go-basic.obo", optional_attrs={'relationship'})

# We are going to use a GO DAG subset for this example
godag = get_godag("../tests/data/i126/viral_gene_silence.obo", optional_attrs={'relationship'})
requests.get(http://purl.obolibrary.org/obo/go/go-basic.obo, stream=True)
  WROTE: go-basic.obo

go-basic.obo: fmt(1.2) rel(2020-12-08) 47,295 GO Terms; optional_attrs(relationship)
  EXISTS: ../tests/data/i126/viral_gene_silence.obo
../tests/data/i126/viral_gene_silence.obo: fmt(1.2) rel(2019-04-17) 79 GO Terms; optional_attrs(relationship)
2. Choose a set of GO IDs to print
This example will use all GO IDs above GO:0060150, viral triggering of virus induced gene silencing
virus_trigger_silence = 'GO:0060150'
3. GO colors
The GO DAG and go-color files for this example are located in: ./tests/data/i126
GO colors are stored in viral_gene_silence.txt as 6-digit hax numbers, like #ffe5b4.
The color file looks like this:
Relationship, part_of, shall be orange (#ffe5b4):
#ffe5b4 GO:0002376 immune system process
#ffe5b4 GO:0050896 response to stimulus
#ffe5b4 GO:0051704 multi-organism process
...
from goatools.cli.gos_get import get_go2color

go2hexcolor = get_go2color('../tests/data/i126/viral_gene_silence.txt')

# For printing GO terms and their color names to the print
hex2color = {
    '#e6fad2': 'green',
    '#ffe5b4': 'orange',
    '#d2d2fa': 'purple',
    '#d2fafa': 'cyan',
    '#fad2fa': 'magenta',
    '#d8dcd6': 'grey',
}
GREY = '#d8dcd6'
GO2COLORNAME = {go: hex2color[rgb] for go, rgb in go2hexcolor.items()}
4. Traversals up the GO DAG
4a. No optional relationships loaded
Do not traverse any optional relationships, like part_of and regulates
from goatools.gosubdag.gosubdag import GoSubDag

gosubdag_r0 = GoSubDag({virus_trigger_silence}, godag)
 GoSubDag:   1 sources in  13 GOs rcnt(True). 0 alt GO IDs
 GoSubDag: namedtuple fields: NS level depth GO alt GO_name dcnt D1 id
 GoSubDag: relationships: set()
# Decide which GO fields to print. Save in prtfmt

# Print one namedtuple
print(next(iter(gosubdag_r0.go2nt.values())))

# Use some namedtuple fields in print of GO terms
PRTFMT = '{NS} {GO} D-{depth:02} {color:7} {dcnt:2} {GO_name}'
NtGo(NS='BP', level=5, depth=8, GO='GO:0060148', alt='', GO_name='positive regulation of posttranscriptional gene silencing', dcnt=1, D1='A', id='GO:0060148')
# Report all ancestors of term, GO:001922 (colored grey)
grey_go = 'GO:0019222'
ancestors = gosubdag_r0.rcntobj.go2ancestors[grey_go]

def prt_goids(goids, gosubdag):
    """Print GO IDs"""
    nts = [gosubdag.go2nt[go] for go in goids]
    for nt_go in sorted(nts, key=lambda nt: [nt.depth, nt.dcnt]):
        color = GO2COLORNAME[nt_go.GO]
        print(PRTFMT.format(color=color, **nt_go._asdict()))

prt_goids(ancestors, gosubdag_r0)
BP GO:0008150 D-00 green   50 biological_process
BP GO:0065007 D-01 green   19 biological regulation
BP GO:0050789 D-02 green   18 regulation of biological process
Plot no optional relationships, just using is_a (runtime script):
Color the term, GO:0019222 regulation of metabolic process, with xkcd’s light grey (#d8dcd6)
$ go_plot.py -o viral_r0.png GO:0060150 GO:0019222#d8dcd6 --obo=viral_gene_silence.obo --go_color_file=viral_gene_silence.txt

Plot no optional relationships, just using is_a (code):
from goatools.gosubdag.plot.gosubdag_plot import GoSubDagPlot

# Color the GO of interest in a copy of the color dictionary
go2col = dict(go2hexcolor)
go2col[grey_go] = GREY

pltobj = GoSubDagPlot(gosubdag_r0, go2color=go2col)
pltobj.plt_dag('viral_r0.png')
1 usr 13 GOs WROTE: viral_r0.png
4b. All relationships
Traverse all optional relationships, like part_of and regulates
gosubdag_r1 = GoSubDag({virus_trigger_silence}, godag, relationships=True)

# Report all ancestors of grey term
grey_go = 'GO:0010468'  # regulation of gene expression
ancestors = gosubdag_r1.rcntobj.go2ancestors[grey_go]
prt_goids(ancestors, gosubdag_r1)
 GoSubDag:   1 sources in  51 GOs rcnt(True). 0 alt GO IDs
 GoSubDag: namedtuple fields: NS level depth reldepth GO alt GO_name dcnt D1 childcnt REL REL_short rel id
 GoSubDag: relationships: {'negatively_regulates', 'regulates', 'part_of', 'positively_regulates'}
BP GO:0008150 D-00 green   50 biological_process
BP GO:0008152 D-01 cyan    17 metabolic process
BP GO:0065007 D-01 green   19 biological regulation
BP GO:0071704 D-02 purple  14 organic substance metabolic process
BP GO:0050789 D-02 green   18 regulation of biological process
BP GO:0019222 D-03 green   13 regulation of metabolic process
BP GO:0043170 D-03 cyan    13 macromolecule metabolic process
BP GO:0010467 D-04 cyan    10 gene expression
BP GO:0060255 D-04 green   11 regulation of macromolecule metabolic process
Plot all relationships (runtime script):
$ go_plot.py -o viral_r1.png -r GO:0060150 GO:0010468#d8dcd6 --obo=viral_gene_silence.obo --go_color_file=viral_gene_silence.txt

Plot all relationships (code):
# Color the GO of interest in a copy of the color dictionary
go2col = dict(go2hexcolor)
go2col[grey_go] = GREY

pltobj = GoSubDagPlot(gosubdag_r1, go2color=go2col)
pltobj.plt_dag('viral_r1.png')
1 usr 51 GOs WROTE: viral_r1.png
4c. Relationship: part_of
gosubdag_partof = GoSubDag({virus_trigger_silence}, godag, relationships={'part_of',})

# Report all ancestors of grey term
grey_go = 'GO:0010468'  # regulation of gene expression
ancestors = gosubdag_partof.rcntobj.go2ancestors[grey_go]
prt_goids(ancestors, gosubdag_partof)
 GoSubDag:   1 sources in  38 GOs rcnt(True). 0 alt GO IDs
 GoSubDag: namedtuple fields: NS level depth reldepth GO alt GO_name dcnt D1 childcnt REL REL_short rel id
 GoSubDag: relationships: {'part_of'}
BP GO:0008150 D-00 green   50 biological_process
BP GO:0065007 D-01 green   19 biological regulation
BP GO:0050789 D-02 green   18 regulation of biological process
BP GO:0019222 D-03 green   13 regulation of metabolic process
BP GO:0060255 D-04 green   11 regulation of macromolecule metabolic process
Plot part_of relationships (runtime script):
Orange dashed lines represent part_of relationships:
$ go_plot.py -o viral_r_partof.png --relationships=part_of GO:0010468#d8dcd6 GO:0060150 --obo=viral_gene_silence.obo --go_color_file=viral_gene_silence.txt

Plot part_of relationships (code)
# Color the GO of interest in a copy of the color dictionary
go2col = dict(go2hexcolor)
go2col[grey_go] = GREY

pltobj = GoSubDagPlot(gosubdag_partof, go2color=go2col)
pltobj.plt_dag('viral_r_partof.png')
1 usr 38 GOs WROTE: viral_r_partof.png
4d. Relationship: regulates
gosubdag_reg = GoSubDag({virus_trigger_silence}, godag, relationships={'regulates',})

# Report all ancestors of grey term
grey_go = 'GO:0050794'  # regulation of cellular process
ancestors = gosubdag_reg.rcntobj.go2ancestors[grey_go]
prt_goids(ancestors, gosubdag_reg)
 GoSubDag:   1 sources in  26 GOs rcnt(True). 0 alt GO IDs
 GoSubDag: namedtuple fields: NS level depth reldepth GO alt GO_name dcnt D1 childcnt REL REL_short rel id
 GoSubDag: relationships: {'regulates'}
BP GO:0008150 D-00 green   50 biological_process
BP GO:0009987 D-01 magenta  8 cellular process
BP GO:0065007 D-01 green   19 biological regulation
BP GO:0050789 D-02 green   18 regulation of biological process
Plot regulates relationships (runtime script):
Purple dashed lines represent regulates relationships:
$ go_plot.py -o viral_reg.png --relationships=regulates GO:0050794#d8dcd6 GO:0060150 --obo=viral_gene_silence.obo --go_color_file=viral_gene_silence.txt

Plot regulates relationships (code):
# Color the GO of interest in a copy of the color dictionary
go2col = dict(go2hexcolor)
go2col[grey_go] = GREY

pltobj = GoSubDagPlot(gosubdag_reg, go2color=go2col)
pltobj.plt_dag('viral_reg.png')
1 usr 26 GOs WROTE: viral_reg.png
4e. Relationship: positively_regulates
gosubdag_regp = GoSubDag({virus_trigger_silence}, godag, relationships={'positively_regulates',})
 GoSubDag:   1 sources in  22 GOs rcnt(True). 0 alt GO IDs
 GoSubDag: namedtuple fields: NS level depth reldepth GO alt GO_name dcnt D1 childcnt REL REL_short rel id
 GoSubDag: relationships: {'positively_regulates'}
# Report all ancestors of grey term
grey_go = 'GO:0048522'  # positive regulation of cellular process
ancestors = gosubdag_regp.rcntobj.go2ancestors[grey_go]
prt_goids(ancestors, gosubdag_regp)
BP GO:0008150 D-00 green   50 biological_process
BP GO:0009987 D-01 magenta  5 cellular process
BP GO:0065007 D-01 green   19 biological regulation
BP GO:0050789 D-02 green   18 regulation of biological process
BP GO:0048518 D-03 green    3 positive regulation of biological process
BP GO:0050794 D-03 green    5 regulation of cellular process
Plot positively_regulates relationships (runtime script):
Magenta dashed lines represent positively regulates relationships:
$ go_plot.py -o viral_rp.png --relationships=positively_regulates GO:0048522#d8dcd6 GO:0060150 --obo=viral_gene_silence.obo --go_color_file=viral_gene_silence.txt

Plot positively_regulates relationships (code):
# Color the GO of interest in a copy of the color dictionary
go2col = dict(go2hexcolor)
go2col[grey_go] = GREY

pltobj = GoSubDagPlot(gosubdag_regp, go2color=go2col)
pltobj.plt_dag('viral_rp.png')
1 usr 22 GOs WROTE: viral_rp.png
4f. Relationship: negatively_regulates
gosubdag_regn = GoSubDag({virus_trigger_silence}, godag, relationships={'regulates', 'negatively_regulates',})

# Report all ancestors of grey term
grey_go = 'GO:0050794'  # regulation of cellular process
ancestors = gosubdag_regn.rcntobj.go2ancestors[grey_go]
prt_goids(ancestors, gosubdag_regn)
 GoSubDag:   1 sources in  26 GOs rcnt(True). 0 alt GO IDs
 GoSubDag: namedtuple fields: NS level depth reldepth GO alt GO_name dcnt D1 childcnt REL REL_short rel id
 GoSubDag: relationships: {'negatively_regulates', 'regulates'}
BP GO:0008150 D-00 green   50 biological_process
BP GO:0009987 D-01 magenta  8 cellular process
BP GO:0065007 D-01 green   19 biological regulation
BP GO:0050789 D-02 green   18 regulation of biological process
Plot negatively_regulates relationships (runtime script):
Cyan dashed lines represent negatively regulates relationships
NOTE: In this example, the following relationships argument will have no affect because no green GO IDs have the relationship, negatively_regulates:
–relationships=negatively_regulates
To see negatively_regulates, specify both regulates and negatively_regulates:
–relationships=regulates,negatively_regulates
Note that specifying both regulates and negatively_regulates will case the magenta GO IDs to be traversed. The magenta GO IDs are accessed by both the regulates and the positively_regulates relationships.
$ go_plot.py -o viral_rn.png --relationships=regulates,negatively_regulates GO:0050794#d8dcd6 GO:0060150 --obo=viral_gene_silence.obo --go_color_file=viral_gene_silence.txt

Plot negatively_regulates relationships (code):
# Color the GO of interest in a copy of the color dictionary
go2col = dict(go2hexcolor)
go2col[grey_go] = GREY

pltobj = GoSubDagPlot(gosubdag_regn, go2color=go2col)
pltobj.plt_dag('viral_rn.png')
1 usr 26 GOs WROTE: viral_rn.png
Copyright (C) 2016-present, DV Klopfenstein et al. All rights reserved